When it comes to business marketing, every company's goal is to share information with others with hopes to grow reach, generate leads, and earn customers.
However, less and less people are interested in reading long, wordy pieces of information that is shared with them via social media, blogs, and emails.
That is where infographics come in.
What Are Infographics?
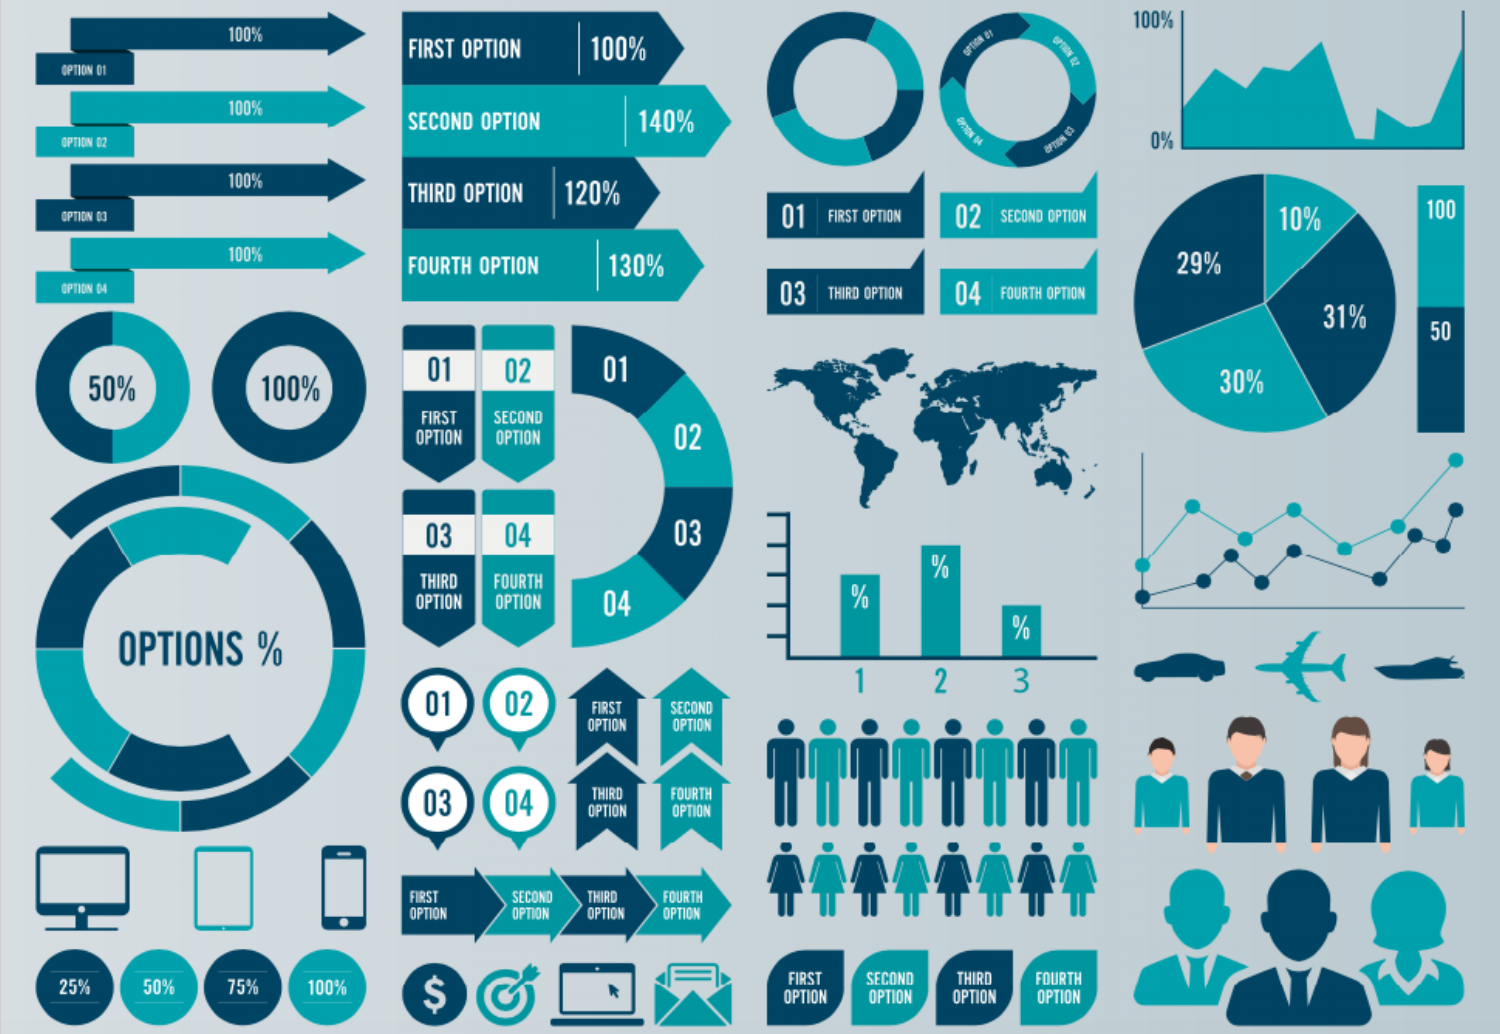
In general, infographics are a visual representation of facts, data, statistics, or other information. In fewer words:
Information + Graphics = Infographics
Infographics are great ways to share a lot of information with few words.
Since so many people today are visual learners, infographics attract customers to learn more about information without forcing them to read a 500-word article.
Types of infographics a company can create include but are not limited to:
- timelines
- how-to guides
- data visualization
- comparisons
- lists
Why Should You Use Infographics in Your Marketing?
Infographics Transform Industry Information into Visual Awesomeness.
The average person gets distracted within eight seconds.
So that's basically how long you have to intrigue a person to read more.
An infographic can take a large chunk of boring, informative text and transform it into a compelling piece that will attract customers and keep them reading.
Visuals drive our world today, and everything we see impacts us in some form or another. With infographics, you can appeal to consumer interests in a way that is eye-catching and beneficial to both the consumer and your future business growth.
Your Content Will Be Easier to Digest.
Businesses that work with highly technical and hard-to-grasp concepts may find that using infographics enables their audience to understand their content easier.
With an infographic, you have the ability to take important facts, data, and analysis and combine it with effective design to create an easy-to-read piece of visual content.
Using infographics will eliminate confusing, wordy paragraphs. By removing the words and adding visuals that represent your words, you have a better chance of increasing engagement and social sharing.
Your Infographic Can Go Viral.
-510326-edited.png?width=600&name=Visual%20content%20is%20(1)-510326-edited.png)
Condensing important industry information makes sharing that information an easier task.
Because infographics are easily shareable, there is a higher chance that your infographic can "go viral."
Making an infographic go viral isn't necessarily the easiest task, but doing so can spread your reach across networks and grow your brand awareness with industry leaders and those interested in the industry you work in.
Make sure you add an embed code to your infographics. This makes it easier for people to share them to their own blog or social media accounts – and it even helps your company generate inbound links back to your website.
Don't forget to include a company logo somewhere on your infographics so your brand is present and easily identifiable. You want to be able to take credit for all the information you share.
Things to Consider When Creating an Infographic
Context
This is by far the biggest thing to consider when you create an infographic. Like everyone says, context is key.
As a business, you want to create infographics that are informative, engaging, and eye-catching. Anything that can be made into a visual element should be made into a visual element – but keep context in mind.
Make sure each element in an infographic has enough context so that what you are trying to tell your audience is easily understood.
Without proper context, you will only confuse the reader. Present industry facts and stats in a context that is relevant to your audience.
Design
Since an infographic is a piece of design work, it is important to consider the type of infographic you want to create based on the content you are working with. In the introduction, I mentioned a few types of content that work well with infographics.
Design drives the meaning of the content and provides context to the infographic. You wouldn't want to create an infographic that is designed in timeline form if you are wanting to share a how-to list. Consider what information you are trying to represent visually, and select a design that complements the content, not competes with it.
The design of an infographic shouldn't be too busy, but depending on the content, you can have a little fun with how you display or represent your information.
For example, if you're creating an ebook and you have a list of data points, an infographic would be a great way to visually represent the data in a fun, engaging manner. Readers will find it more interesting than a list of bullet points or a text heavy paragraph.
Color
What colors you select could make or break the success of an infographic.
It's important to choose colors that reflect the tone of the infographic you are creating. The more serious the topic, the more professional-looking colors you should use.
Define a color scheme and select which elements, if not all, of the infographic you want to add color to. You can choose to add color to the actual text or create a color background for an element of your infographic that you may want to stand out.
An infographic is used to attract readers to your content, and colors are a great tool to utilize in design to captivate someone's attention.
Typography
Typography is another element of an infographic that should coincide with theme. I am no expert on typography, but here are some helpful tips I have learned:
- Create a text hierarchy by choosing fonts with different sizes, weights, and color.
- Use contrasting typefaces to increase visual appeal.
- Select legible fonts.
- Take into account the spacing between your textual elements.
- Less is more: text should complement the graphic elements, not overwhelm them.
There are millions of fonts to choose from, so don't get stuck looking at every single one in search of the "perfect" font; there are plenty of great, clean-looking fonts that would work for any type of infographic.
White Space
When it comes to infographics, white space is your friend. Have you ever looked at something and it was so cluttered your eyes didn't know what to focus on first?
Yeah, that's not a good thing, especially when it's something you want prospects and customers to actually look at. When designing an infographic, you want to refrain from filling every part of your design space.
The main focus of your infographic should be surrounded by a moderate amount of white space.
Considering white space in your design will keep your audience focused on the main point of your infographic and improves readability, dissolving any confusion for the reader.
Remember: less is more. You may want to segment your topic into several infographics. Doing so will eliminate clutter and showcase more specific content.
So How Do I Start Designing an Infographic?
You don't have to be a super-skilled designer with years of experience to create an infographic.
Luckily, there are now tons of sites, like Canva and Venngage, that allow you to design stunning, customizable graphics with simple drag-and-drop features. You can also download free infographic templates for easy use.
If you want to take a crack at designing an infographic on your own, do some research. It can't hurt to look at other infographics (Pinterest has hundreds of quality infographics you can skim through) to find inspiration for a design aesthetic you like.
Whether you are using infographics to visualize your newsletters, share on social media, or summarize the main points of a blog, adding graphic elements to your content can strengthen your brand awareness and give you "expert" level attention.
Consider implementing infographics into your company marketing strategy. It can't hurt your company to redistribute helpful information about your industry. It may even grow your reach both organically and through social media and attract new customers.


.png)
Comments