
Poor communication kills businesses.
When leaders don’t know how their teams are performing (and team members don’t know what their leaders want or need), then communication suffers, initiatives fall through, and the business loses money it could have easily gained.
Business reports can provide a critical communication tool for business leaders, giving them the insights they need to keep track of progress toward important business goals and to make course corrections when needed.
What is a business report? How do you write a business report?
Here’s an explanation of business reports, some business report examples, and a few tips for how to write a business report.
What Is a Business Report?
A business report is a formal piece of written information used for specific business purposes.
It typically includes descriptions of procedures to follow, followed by data collection and analysis. Then, the person presenting the documented report discusses the significance of the procedures and the conclusions drawn from the analysis of that data.
Business reports are often recorded and shared within a business to ensure that it can be referenced if needed in the future.
One of the difficult things about business reports is that they may vary greatly from one organization to the next. The data that is important to, say, an accountant or tax attorney’s office might not be as relevant to a business specializing in selling electronics or software, even though they may use many of the same documents at tax time!
Types of Business Reports
There are many kinds of business reports that an organization might use. Some common types of business reports include:
Formal Business Reports
These reports generally conform to some established process, and they may be required for compliance with certain regulatory requirements. Many formal reports, when mandated for compliance, have a standardized form that you need to complete.
These reports are often distinguished from informal business reports by their intent, structure, and length. Many of the specific reports listed below may be considered formal reports.
When created specifically to comply with some type of regulation, these reports may be called “statutory reports.”
Informal Business Reports
So-called “informal” business reports include things like intra-company memos or letters intended primarily for use within your organization.
Because these are strictly internal documents meant for convenience rather than meeting a specific regulatory requirement, they often have a simple, plain-text format. In many cases, an informal report will be shorter than a formal report, though that isn’t a “hard and fast” rule.
However, some companies do choose to use a specific business report format or template even for their more informal or internal communications. This can help create consistency for these reports.
Many of the report types listed below could also be classified as informal reports depending on their format.
Analytical and Research Business Reports
These reports collect sets of data and then study them to create an analysis and make recommendations based on that research.
For example, a company might create an analytical report detailing customer demographics data in several regions and segments to determine how and where to market their products or open new distribution centers.
Informational Reports
An informational report is a report that records a particular piece or set of data for later interpretation. Expense reports, inventory logs, and sales reports could all be considered examples of informational reports.
Unlike analytical reports, these documents typically don’t include explanations or recommendations – though the data they contain could be used to make decisions later on.
Summaries
This is a type of business report that seeks to take a complex topic or data set and explain it as succinctly as possible. Summaries are often an informal type of business report prepared by secretaries or aides to save executives time when making decisions.
These may occasionally be used as the basis for a press release or other external-facing document.
Performance Reports
These reports collect a set of performance metrics about a department, team, or individual within the organization. The contents of these reports may vary depending on the department of the individual being assessed. After all, accountants aren’t generally going to be held to the same standards as sales reps.
In many cases, data from performance reports may be used to make decisions about staffing or certain business initiatives – so there may be overlap with analytical reports.
Minority and Majority Reports
When there’s a committee with three or more people formed to make a business decision, they may have a difference of opinion.
Majority and minority reports collate the findings of the respective sides of the split. The report from the side with fewer members is called the minority report, while the report from the larger side is called the majority report.
Quarterly and Annual Reports
Periodic reports given at set intervals to help review processes and progress toward major business goals. Quarterly and annual reports may have different focuses in different organizations.
In some organizations, the annual report may be a collation of the individual quarterly reports. Or, it may involve a more in-depth look at a long-term initiative and how it has impacted the company.
Sometimes, these reports may be prepared on a more frequent basis and simply referred to as “periodic reports.”
5 Business Report Templates and Formats
There are as many business report formats as there are companies that compile them. While some business forms may use a standardized format (especially if they’re legally required “statutory business reports”), others may not have a standard format.
Here are a few business report templates and samples you could use to make a report in the future:
1. Employee Sales Report Template
|
Store Identification #: |
|
|
Employee Name: |
|
|
Date of Sales Review: |
|
|
Gross Sales Goal: |
|
|
Gross Sales Value: |
|
|
Hours Worked: |
|
|
Average Value Per Hour: |
|
This informational report template could be used as a basis for a future employee performance assessment.
In particular, tracking hours worked in a given period against the total gross revenue generated by that employee can be valuable for fairly measuring how valuable an employee is compared to others who may be working a greater or lesser number of hours.
Naturally, some organizations may add fields to include the sale of specific products to track progress toward specific goals.
2. Activity Report Template
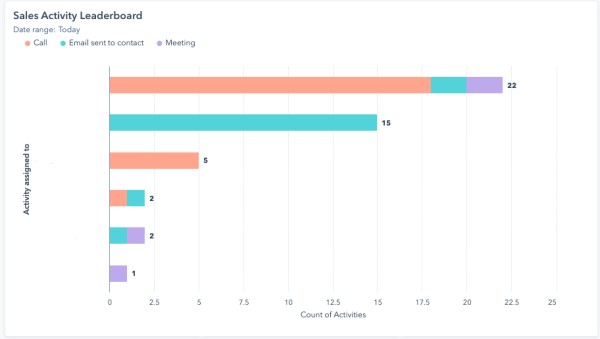
The above image is a default report template in HubSpot that showcases the sales activities of individual employees on the sales team to track how active they are.
This report can be used to gauge how frequently a sales team member is engaging in critical activities. Similar bar charts could be used to help track other frequent activities.
3. Departmental, Team, or Store Sales Report Template
|
|
Actual |
Projected |
Variance |
% Difference |
YTD Actual |
YTD Projected |
YTD Variance |
YTD % |
|
Sales in $ |
|
|
|
|
|
|
|
|
|
Revenues |
|
|
|
|
|
|
|
|
|
Margin |
|
|
|
|
|
|
|
|
|
Number of Orders |
|
|
|
|
|
|
|
|
|
Average Order Value |
|
|
|
|
|
|
|
|
The data from this table could be used to populate a line chart showing the projected and actual sales for a given department, team, or location over time.
Such reports are often conducted on a weekly, monthly, or quarterly basis.
4. Expense Report Template
Expense reports can be difficult to create a generic template for because different businesses and industries will have different expenses to track.
It can help to create broad categories of expense types and track them in an Excel file or an expense tracking software that can automatically log your business’ expenditures by type.
Many expense reports meant for easy consumption have a format like this:
- A large pie chart that graphically represents each expense type.
- Bar charts showing side-by-side comparisons of each expense type.
- A budget vs. expense table that collates each expense type and their totals compared to the available budget.
Some of these expense reports may add in projected income from a sales report to analyze the company’s risk of overstepping their budget.
5. Research Report Template
Many businesses need to conduct extensive research in preparation for a new initiative or product launch. Research reports help these businesses collect data and provide an interpretation of the facts that they can use to benefit the company.
While the actual structure of a research report may vary depending on the type of research and the company, a basic outline generally includes:
- The report preparer’s name (or names, if multiple researchers are involved) and contact information.
- A background or abstract summary of the report detailing the reason for the report and its goals.
- A “Key Findings” summary, which is often in bullet point list format. This is used to provide a quick list of the most important data points and conclusions from the study.
- The body of the report. This will typically contain the majority of the text as well as figures and images that help highlight important data points.
- A conclusion that summarizes the results of the research.
- Recommendations for what the company may need to do based on the findings from the research.
- A list of references for any outside sources or studies used in the research document.
How to Write a Business Report: Best Practices to Keep in Mind
The report templates outlined above can help serve as a starting place for various formal or informal business reports. However, simply following a template, even a good one, doesn’t guarantee that the report will be valuable.
To create great business reports that will help improve outcomes instead of wasting time, here are a few things to keep in mind when writing them:
Keep Your Report Objective, Not Subjective.
The ultimate goal of most business reports is to clearly communicate facts, not opinions.
Emotional appeals using descriptive adjectives such as “terrible," "awful," "great," and "superb” sound good, but don’t add accuracy to a report. Instead, try to keep your language simple so it only communicates the facts.
This may sound counter-intuitive when writing an analysis-based report that calls for some conclusion or suggestion. However, maintaining an impersonal tone that focuses on actual data rather than emotional descriptions is better for a formal report meant to present objective facts.
Maintain a Consistent Report Structure for Each Type of Report.
Does your business have a standardized format for each of its reports? If not, then that should be established as soon as possible.
Following a simple template for each type of business report can help make it easier for readers within the organization to quickly understand the content of the report. This, in turn, can help readers save time.
Submit Your Reports for Revision by at Least One Person.
Proofreading is a critical step for any piece of professional writing. Even this blog article you’re reading was proofread by two people before getting published!
Why? Because, we all make mistakes, especially when there’s a deadline coming up and there’s enormous pressure to rush to get things done.
Having a second (or third) set of eyes on a business report before it gets submitted for the boss or long-term storage can help ensure that basic factual and grammar mistakes are avoided. This, in turn, helps you write a better business report.
Consider Your Report’s Intent and Audience.
Why are you writing this report? Who is it going to be presented to? Knowing the answers to these questions can help you frame your report’s contents more effectively.
For example, if the report is meant to help C-level execs make a decision about whether to continue or halt a specific new product launch, you may want to emphasize market research statistics, analyze the budget, and have a projected cost vs. profit estimate in the report.
If the goal of the report is simply to collect and present data points, then keeping extraneous text to a minimum and sticking to simple, easy-to-interpret data tables and graphs may be better.
Knowing your report’s intent and audience is crucial for writing effective reports. It can also help you understand what you need to know to write your report in the first place.
Verify Your Data Points and Sources.
For many informational reports, the report will only be as good as the data found in it. So, it’s often important to verify data points in a report before submitting it.
This may involve checking independent sources, tracking past reports to see if the information in your report is consistent with them, or simply rechecking the data you put down in the report with the source material to verify that it was recorded correctly.
This is especially important when writing reports that call for recommendations based on the data within because inaccurate data points may result in bad decisions. Cherry-picking sources and data may help make a proposal more attractive, but that doesn’t mean the underlying recommendation will be effective.
It’s more important that a report accurately reflects reality than simply “winning” an argument.
Make Sure Your Visual Elements Make Sense.
Images and graphical design elements can be crucial for making a report easy to interpret. Pie, bar, and line charts are all effective ways of visually representing key data points.
However, it’s important to verify that you’re using the right visual elements for your report.
When adding a visual element such as an image or chart to the report, consider the following:
- Will the image be too cluttered? Simple visual elements are easier to interpret, but complex ones (like line charts with 20+ lines) can be too difficult to parse.
- Does the type of visual element used make sense for the data being presented? Pie charts excel at giving a quick estimate of percentage relationships between several related data points, bar charts are good for quick comparisons, and line charts are useful for tracking a few data points over a specific time frame. Make sure you’re using the right graphic for the data you want to present.
- Is the data point relevant to the report? If a piece of data isn’t relevant to the report, then you should probably skip it.
In many cases, a report’s format may include a specific type of graphic to use. However, since some reports may need different types of data from one report to the next (such as in research reports), it’s important to know when and how to choose graphic elements that complement those data points.
When your team knows how to properly present their findings in different business reports, you're fostering good communication and collaboration. That is key to business growth.


.png)
Comments