
If you want to perfect your marketing efforts and get the best results, you need to perform in-depth analyses of your campaigns.
It’s not enough to know that your site attracted X number of visitors and had Y conversions, you need to get more granular and look at the details, like where those visits and leads came from and how they interacted with your site.
This is where analytics solutions such as HubSpot’s analytics and Google Analytics come into play. While using multiple analytics solutions can provide greater depth of information, most of us only have the time and the budget for one or the other.
So, which analytics solution should you use? Let’s do a little HubSpot vs. Google Analytics comparison to find out how these tools can help you drive results.
What Are Analytics Tools?
Web analytics is the process of collecting, reporting, and analyzing data from a website. The data you collect from your analysis helps you to measure how well your efforts are performing compared to the goals you have set.
via GIPHYAnalytics tools are designed to make collecting and interpreting web analytics easy. Essentially analytics tools gather, organize, and present data relating to your website’s performance for you. There is no need for you to perform the technical side of web analytics when you use an analytics tool.
Some of the top analytics tools on the market today are:
- Google Analytics: This free go-to starter tool helps you measure data on your site easily.
- Ahrefs: Ahrefs is a popular analytics tool that is praised by experts in the industry.
- SEMrush: SEMrush is a paid tool that helps you use web analytics to create user-focused content.
- Clicktale: With Clicktale, you can see what actions your users take when viewing your site and review your reports to see what works and what doesn’t
- HubSpot: HubSpot has marketing analytics tools that allow you to measure all or your marketing campaigns’ performance in one place.
- Crazy Egg: Crazy Egg offers you a variety of maps that you can view to see where your users are browsing on your website.
5 Benefits of Using Analytics Tools
It’s difficult to be efficient when you don’t know what is going on behind the scenes on your website. You need to know what is working and what isn’t. Analytics tools provide you with an easy way to do this.
Here are five other benefits of analytics tools:
They Help You Get to Know Your Visitors Better.
Analytics tools help you to identify where your website visitors are located. Geographical information is tracked using the IP address of your visitors. Knowing this information about your visitors can help you to learn how to focus on targeting the right areas.
via GIPHYYou can also look at your visitor’s behavior and digital engagement to then determine which marketing channels you should be focusing your efforts on.
They Allow You to Gauge the Success of Your Marketing Activities.
As you roll out marketing campaigns, you can track them easily with analytics tools. The data you collect can help you to see which marketing campaigns or channels are the most effective.
This saves you time and resources spent on marketing activities that aren’t creating conversions.
They Indicate How You Should Optimize Your Website.
With analytics tools, you can see which browser most of your visitors are accessing your website from. You can also see which links and CTAs visitors are clicking on.
This is vital information for you to consider when you redesign your website. The right configuration and layout on your website can help you optimize your website conversion paths.
They Show You the Customers You Are Losing.
You can view your bounce rate when you look at the data presented by your analytics tools. A bounce represents a person who visits one of your webpages and then quickly leaves without clicking on any other pages.
via GIPHYYou may notice a trend in your bounce rates, and then be able to identify and implement a solution to help reduce your bounce rate.
They Provide You With Data That Allows You to Target Prospects.
You can track your customers' journey based on what they view and engage with on your website with analytics tools.
You can segment your repeat visitors and create different CTAs to target your prospects to help provide them value and nurture them through the sales process.
As you can see, it's crucial to use the right tools and get your reporting in order. This sets you up for improving site performance to gain more traffic, convert more leads, and close more customers.
If your website is built on HubSpot, you can start gathering vital data in just a few simple steps.
How to Measure Site Performance on HubSpot
HubSpot has a great traffic analytics tool that is automatically coded into your site when you create your site on the platform. If you have an externally hosted page, you have to install the HubSpot tracking code yourself to monitor your website traffic.
Here are some easy steps to help you measure site performance on HubSpot:
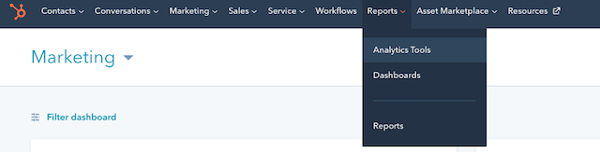
1. Go to the Reports tab in your account. Navigate to Analytics Tools.
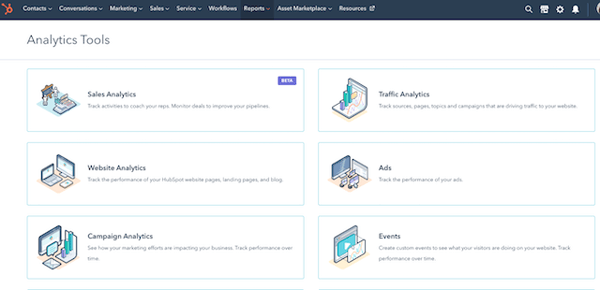
2. You'll be taken to a page with various analytics tools and options. Click Website Analytics.
3. Select the date range and frequency menus to help you filter the data according to the dates you want to view.
4. Next, select page types to choose the page type you want to measure. Landing pages are on default, but you can choose between blog posts and website pages as well.

- Click filter [page type] to see various metrics. For example, you can view blog post metrics by author, blog tag, and language.
Chart
If you want to see a chart of the metrics, click the dropdown menu in the upper left of the chart. Select one of these metrics:
- Page views
- New contacts
- Customers
- Submissions
- Submission rate
- Contact conversion rate
- View to customer rate
- Entrances
- Exits
- Average time on page
- CTA views
- CTA clicks
- AMP views
- CTA %
Select the Style dropdown in the upper righthand corner of the chart to choose the type of chart you’d like to analyze.
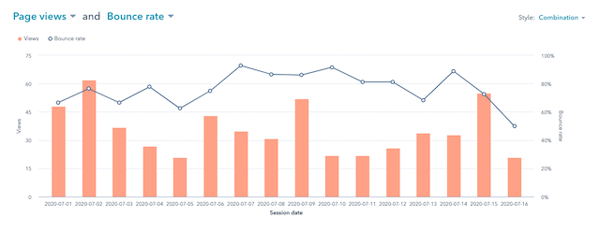
The chart can be area, column, or line, or a combination of area and line charts.
Table
There’s a table below your chart that shows you detailed data for you to analyze. If you want to customize the metrics in that table, select Edit columns in the upper righthand corner.
1. Select the check box for the metrics you want to display.
2. Save your work to apply changes.
3. Search for a specific page in the search bar.
4. Sort the pages by a specific metric by clicking the column header.
5. To compare the impact of multiple pages, select the checkbox next to a page to include it in the comparison.
6. Click one page to view it in detail in another tab.
You may also save the chart as one of your reports by clicking "save as report" on the right side of your screen. Name your report so you can find it easily in the future.
HubSpot offers user-friendly tools for businesses to track and monitor their web performance to see if their marketing efforts are working. Google Analytics is also a great free tool for you to use if you need a more in-depth look at your web performance.
You can use both of these analytics tools to get a multifaceted understanding of how your site is performing.
10 Similarities and Differences Between HubSpot Analytics and Google Analytics
HubSpot and Google Analytics have many features that overlap each other since they share the same goal – to help businesses track website performance. But they also have different approaches to the way they choose to display the data they collect.
via GIPHYThe one that is best for you depends on what you hope to achieve from looking at your website analytics.
Here are a few similarities and differences between the platforms by category to help you understand each platform fully:
Page Views
- Similarities: Google Analytics and HubSpot both show you the page views for your blog posts, website pages, and landing pages, and all page types together. They both allow you to check average time spent on each page, entrances, exit rate, bounce rate, and CTA clicks and views.
- Differences: Only Google Analytics allows you to see your unique page views.
Traffic Reporting
- Similarities: Traffic analytics are available for you to view in both HubSpot and Google Analytics.
- Differences: HubSpot gives you the ability to track traffic year over year and month over month, and it provides you with the option to compare custom set dates. Google Analytics dives into traffic reporting more by allowing you to check the devices your visitors are using or by tracking new and returning traffic to your site.
Conversion Rates
- Similarities: Both platforms inform you about which pages users convert on.
- Differences: Google Analytics enables you to take conversion tracking one step further by allowing you to track your visitors’ every interaction within one session.
Goal Setting
- Similarities: Google Analytics and HubSpot provide you with the features you need to set up various goal types.
- Differences: HubSpot gives you the opportunity to set up quotas specific to your user for sales teams. They also allow you to set up goals in workflows.
Sources
- Similarities: HubSpot and Google Analytics both have a system that displays your traffic sources such as organic traffic, social media, and email marketing for your whole website.
- Differences: Google Analytics takes sources a bit further and allows you to see the medium, which is the category of each source. They also let you see web referrals and cost-per-click paid search sources.
HubSpot's web analytics interface is easy for marketers to read and understand. It gives them the numbers they need for their monthly reports to reflect what is going on with their leads and traffic.
Google Analytics provides you with a more comprehensive view of what is going on with your leads, traffic, and PPC ads. Mostly, the tool you choose depends on the kind of data you need to help you achieve your goals.
To get a full view of everything you need to know about your site performance, consider using both of these analytics tools. They deliver the insights you need to continue optimizing your efforts and crushing your goals.
.png)
Comments